FY 25 Budget Q&A #053: The Budget Question #17 estimate of the tax-rate impact of the ACPS CIP add assumed that the entire addition was funded by debt. Can you show a few scenarios where we financed the add with a cash capital and debt mix?
Question: The Budget Question #17 estimate of the tax-rate impact of the ACPS CIP add assumed that the entire addition was funded by debt. Can you show a few scenarios where we financed the add with a cash capital and debt mix?(Mayor Justin Wilson)
Response:
Fully funding the School Board Approved FY 2025 – FY 2034 Capital Improvement Program (CIP) funding request would require the addition of $65 million for the following items:
- FY 2025: Increase of $20.0 million for George Mason Elementary Hard Costs (Construction)
- FY 2028: Increase of $9.0 million for Cora Kelly Elementary Soft Costs (Planning/Design)
- FY 2029: Increase of $36.0 million for Cora Kelly Elementary Hard Costs (Construction)
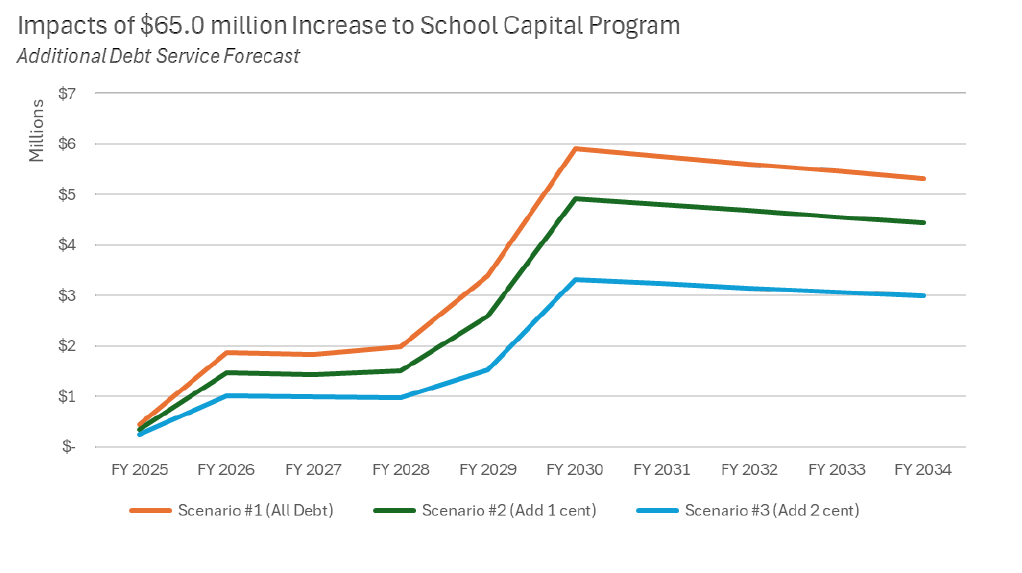
In Budget Question #17, the estimated impact of these additions to the Proposed CIP, assumed a 100% use of additional borrowing to support the School Board Request. This resulted in an impact of approximately $0.9 million in FY 2026 for additional debt service and then increasing to $6.0 million in FY 2029, the point at which all $65.0 million of additional proceeds would be required.
Funding Scenarios
Alternatively, it would be possible to use a mixture of additional borrowing and pay-as-you-go cash capital to alleviate some of the longer-term cost burdens of borrowing. The analysis below considers four scenarios for comparison:
- Proposed CIP – no addition to the proposed CIP; 10-year planned funding for Schools remains at $314.0 million
- Scenario #1 All Debt – the scenario discussed in Budget Question #17; adds $65.0 million to the CIP 100% via additional borrowing
- Scenario #2 Adding 1 Cent – this scenario assumes a 1 cent increase in the real estate tax rate, which would generate approximately $4.7 million in revenue annually. This $4.7 million is then used to increase cash capital to the Schools capital program and mitigate the amount of borrowing required for the additional $65.0 million. For FY 2025 – FY 2029, any amount of the $4.7 million not used to address the additional debt service is deployed as cash capital.
- Scenario #3 Adding 2 Cents - this scenario assumes a 2 cent increase in the real estate tax rate, which would generate approximately $9.4 million in revenue annually. This $9.4 million is then used to increase cash capital to the Schools capital program and mitigate the amount of borrowing required for the additional $65.0 million. For FY 2025 – FY 2029, any amount of the $9.4 million not used to address the additional debt service is deployed as cash capital.
The table below summarizes the financing details of the described scenarios. In both the 1-cent and 2-cent scenarios, the revenue generated could address the impacts of the addition of $65.0 million in Schools capital with excess revenue available starting in FY 2030 to mitigate the already significant challenges of funding the expenditures contemplated in the City Manager’s Proposed FY 2025 – FY 2034 CIP.

Additional Debt Service Forecast
The chart below illustrates the additional debt service that is forecasted in each scenario from the increased issuances in FY 2025, FY 2028, and FY 2029 to support George Mason and Cora Kelly Elementary Schools at the School Board contemplated funding level. This represents increased debt service costs above and beyond the forecasted increases that are contemplated as part of the City Manager’s Proposed FY 2025 – FY 2034 CIP.

Net Cost Impact on the Operating Budget
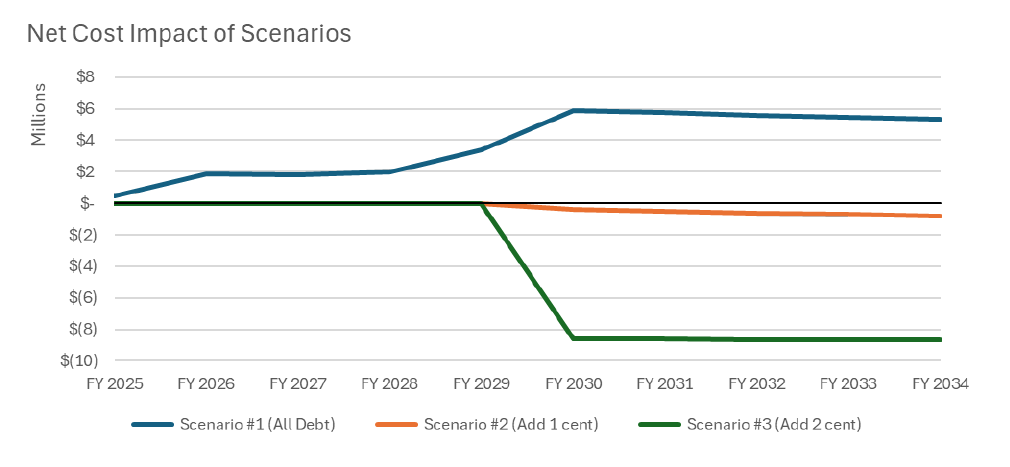
Beyond FY 2030, when debt service associated with these CIP increases is forecasted to peak, Scenarios #2 & #3 would have excess revenue available to be used as cash capital, redeployed to address the forecasted increases in debt service that are already contemplated in the Proposed CIP, or other operating budget priorities. Additionally, between FY 2026 and FY 2028, Scenarios #2 & #3 would present opportunities to marginally reduce borrowing for the Schools capital program. The chart below illustrates when this revenue becomes available for repurposing (represented as the negative numbers starting in FY 2030).

Impacts on Debt Management Policies
Scenarios #1, #2, and #3 all require some level of additional borrowing to fully address the School Board’s capital funding request. Although Scenarios #2 and #3 would mitigate the debt service impacts of this request via increases to real estate tax revenue, the additional borrowing will impact the City’s debt management ratios and create additional pressure on the City’s debt capacity.
This impact is most prevalent in the ‘Outstanding Debt as a Percentage of Fair Market Real Property Value’ ratio. In the Proposed CIP, and Scenarios #1, #2, and #3, this ratio is forecasted to peak in FY 2029. The table below outlines what this ratio is forecasted to be in FY 2029, and what remaining debt capacity there would be in each scenario.

Reductions in the City’s debt capacity provide less flexibility for future and unforeseen capital needs. Although the City Council may adopt changes to the debt management policies, this would need to be considered within the context of the City’s overall financial health and whether this would impact the City’s status as a AAA/Aaa-rated municipality.
Printable Version