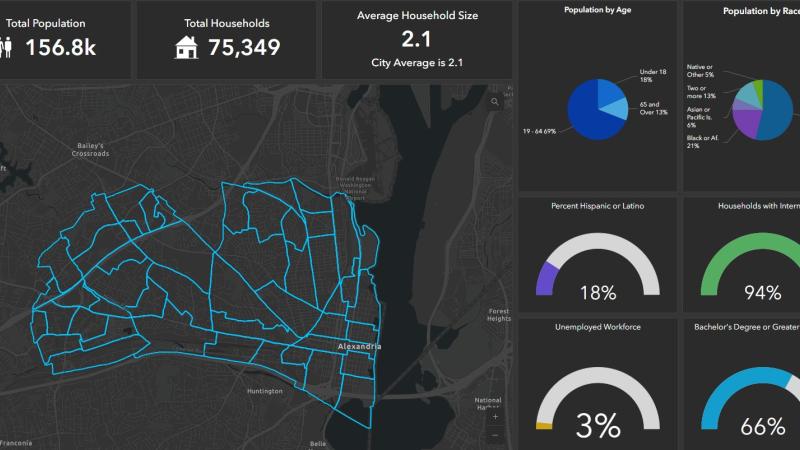
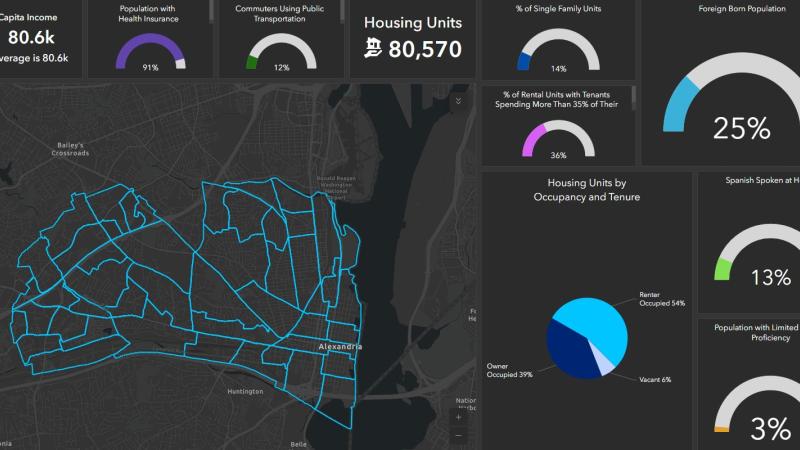
Alexandria Demographics and Statistics
Demographic Dashboards

Student Generation
ACPS and City staff regularly update a joint analysis of the number of students “generated” by different housing types in the city. See student generation rates.

Student Enrollment
ACPS provides enrollment projections annually as part of budgeting for capital improvement projects (CIPs). Click here to see the November 2024 Presentation on FY26-35 CIP.
Trends in Racial & Ethnic Diversity
Archived Information
Reports and Presentations
- Diversity. Alexandria's Racial and Ethnic Groups and Foreign-Born Population. This brief report outlines and compares some key characteristics of the Black or African American, Hispanic, Asian and Non-Hispanic White populations in Alexandria, based on the 2010 Census and the most recent annual and 5-year average American Community Survey data on age, income, educational attainment, household structure and other characteristics (February 19, 2015).
- Alexandria - City of Millennials? This memo prepared by city staff reports on a study released by RealtyTrac that shows Alexandria and Arlington as the U.S. jurisdictions with the greatest percentage growth in Millennials from 2007 to 2013. With more than four 30-year-olds for every 20-year-old in the city, Alexandria definitely deserves its share of the Millennial championship. And beginning in 2022, we'll transition to the Generation Z champs instead, (though the city's baby-boomer demographer isn't likely to be here to take credit for his prediction) (October 10, 2014).
- American Community Survey 2013 Narrative Summary. This brief newsletter prepared by city staff reports highlights from the 2013 annual data, released by the Census Bureau on September 18, 2014. The data shows an increase in the share of Alexandria’s households that are families with children, and a continuing trend to increasing ethnic and racial diversity. The senior share of the population continues to decline, but that trend is expected to reverse soon as more and more baby boomers pass the 65-year mark (October 2, 2014).
- American Community Survey 2011 Narrative Summary. This brief report prepared by city staff summarizes information about Alexandria from the 2011 1-year survey. The report notes changes since the 2010 Census, and compares Alexandria to nearby jurisdictions, other counties and independent cities of 65,000 people or more in the U.S., places in the U.S. of 65,000 people or more, and the United States as a whole (January 29, 2013).
- 2010 American Community Survey Summary Table . This table was prepared by City staff to compare some key statistics for 2010 and prior years. The table compares various statistics for 2010 with 2009, the 2005-2009 American Community Survey 5-year average, and the 2000 Census. In making comparisons, users should consider that the American Community Survey is based on a very small sample (less than 1000 households in the City each year), and some changes in values, particularly where the values are small, do not necessarily indicate a change in this value for the entire population.
- 2009 American Community Survey 5-year Average Data for Alexandria . (PDF file) A City-prepared table of selected population, economic and housing statistics from 2009 American Community Survey 5-year average data, compared to Census 2000 and 2009 annual data.
- County-to-county commuter flows. These graphs show the percent of commuters into and out of Alexandria from the top 25 county origins and destinations based on the American Community Survey 2006-2010 average, and compare these flows to those from the same jurisdictions in 2000. There were some subtle but no significant changes among the major origins and destinations over this relatively short period (March 9, 2013).
- County-to-county migration inflows to Alexandria. 11 x 17 inch PDF graph showing the top 100 world sources of people moving to Alexandria from the American Community Survey 2005-2009 5-year average data.
- County-to-county migration outflows from Alexandria. 11 x 17 inch PDF graph showing the top 100 destinations in the U.S. for people moving from Alexandria.
- Alexandria 2010 Census Data Profile. A profile of the city in 2010 prepared by city staff based on a variety of U.S. Census sources is now available for on-line viewing or downloading. Based on the 2010 U.S. Census, 2006-2010 American Community Survey 5-year average data by census tract, and the 2010 American Community Survey, the report includes comparisons to the City in 2000 and earlier, to surrounding areas including the Washington, D.C. metropolitan area, and to the U.S as a whole. Data on population and race dating from the first U.S. Census in 1790 is included. The report outlines the important and continuing influence of the postwar baby boom on growth and change in the U.S. and the city. Recent changes in race and ethnicity within the city are mapped. The report also includes data on income, education, housing tenancy, ancestry, commuting, disability, foreign-born population, geographic mobility, and many other characteristics that help define the Alexandria of today (March 5, 2012).
- Census 2010 Comparative Demographic Profiles for Alexandria, the region, Virginia and the U.S. This 8-page table compares Census 2010 demographic profiles for Alexandria, Arlington County, Fairfax County, the Washington, D. C. metropolitan region, the state of Virginia, and the United States. Selected comparable data for Alexandria from the 2000 Census is also provided. The data indicate that the City has grown about 9.1% in total population since 2000, consistent with the City's long-term growth of about 1% per year since 1960. The housing count indicates that the City's average household size has remained approximately constant since 2000.
The 2010 race and ethnicity data does not show dramatic changes in the city's overall racial and ethnic makeup since 2000. When viewed at the tract level, however, both the Hispanic and Black or African American populations have changed in their concentration and distribution within the city. The Hispanic population has grown about twice as fast as the citywide total, reaching 16.1% of the total in 2010. The Black and African American population has grown a little more than half as fast as the total, declining to 21.8% of the total in 2010. The Asian population has grown faster than the overall average, reaching 6% of the total in 2010. While the number of vacant housing units and the vacancy rate show a significant increase from 2000, the City's vacancy rate varies cyclically between census periods, and was at an unusually low rate at the time of the 2000 Census. More than half of Alexandria's housing units are rentals, and the 5.9% vacancy rate observed at the time of the 2010 census is within the range of vacancy rates that is consistent with a healthy housing market in which units are generally available but not staying vacant for long periods of time.
- Census 2010 Age Profile for Alexandria . This graph compares Alexandria's population in 5-year age groups with similar data for the United States, and for Alexandria in the year 2000.
- Census 2010 Redistricting Data Table for Alexandria . This table summarizes the first data release from the 2010 Census, the initial redistricting data for the City as a whole, and compares this data to similar data from the 2000 Census.
- People, Place, Change . Presentation by Planning Director Faroll Hamer to Alexandria Library staff on Library Staff Day. Covers recent changes in the demographics of the city, and trends shaping the future (May 18, 2012).
- Census 2010 Data Profile . Presentation to City Council summarizing population, economic, housing, commuting and other information from recent releases of additional information from the 2010 Census and the 2006-2010 American Community Survey 5-year average data. The complete report on which the presentation is based can be found here (April 24, 2012).
- Census 2010 Redistricting Data Briefing. Presentation to City Council. This briefing also includes a comparison of the City to other jurisdictions in the region and to the nation as a whole based on information from the 2005-2009 5-year American Community Survey average data (February 22, 2011).
2020 Census
Alexandria achieved a complete count in the 2020 U.S. Census. Learn about the census and how the data is used to help Alexandria residents.
2010 Census Presentations
This page provides PDF copies of presentations including demographic information, trends and forecasts.
- May 18, 2012. People, Place, Change . Presentation by Planning Director Faroll Hamer to Alexandria Library staff on Library Staff Day. Covers recent changes in the demographics of the city, and trends shaping the future.
- April 24, 2012. Census 2010 Data Profile . Presentation to City Council summarizing population, economic, housing, commuting and other information from recent releases of additional information from the 2010 Census and the 2006-2010 American Community Survey 5-year average data. The complete report on which the presentation is based can be found here .
- February 22, 2011. Census 2010 Redistricting Data Briefing. Presentation to City Council. This briefing also includes a comparison of the City to other jurisdictions in the region and to the nation as a whole based on information from the 2005-2009 5-year American Community Survey average data.
Related Information
Questions?
Contact Carrie Beach, Division Chief, NPCD, Department of Planning and Zoning, carrie.beach@alexandriava.gov, 703.746.4666.

